Engagement report
The "Engagement report" section provides detailed statistics on email campaigns and recipients engagement.In this area you have:- Email opens trend
- Email clicks trend
- Top providers trend
- Engagement trend
General info
- The time unit used is daily. It shows only the days on which at least one mailing was sent. The detail of each email is visible by selecting the single bar.
- The dashboard considers only emails sent to at least 50 recipients. Therefore, transactional mailings are usually excluded.
- The opens and clicks shown are always unique.
- The dashboard has two values on the y-axis. The values on the left refer to the bars. While the scale on the right refers to the lines.
- Update frequency: The statistics are refreshed once a day, and they refer to the previous day.
Apply filters
Reports can be filtered by date (entering a time frame) subject or message notes and, by picking a provider and maximum or minimum range (at least 50) of recipients.
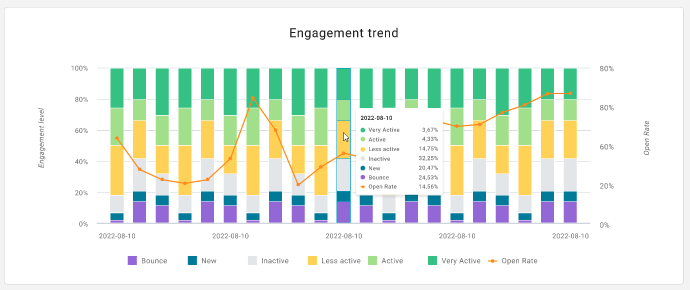
Engagement trend
The graph relating to the engagement trends provides an overview of the composition of the mailings in terms of engagement (i.e. the engagement of the recipients reached). For each day in which at least one sending was made, the graph divides the recipients into very active, active, new, less active, inactive, or bounce, overlapping the opening rate statistic to evaluate any correlations with engagement levels.
Let's see what they mean.
Label | Descrizione |
|---|---|
| Bounce | The recipient registered a high number of soft bounces |
| New | There is still no information on the rating because it is the first time they are reached by a sending |
| Inactive | The recipient has shown an extremely low degree of engagement, it is a contact that does not interact with the campaigns he receives |
| Less active | The recipient has shown a low degree of engagement, it is a contact who rarely interacts with the campaigns he receives |
| Active | The recipient has shown an average degree of engagement, it is a contact who often takes actions on the campaigns he receives |
| Very active | The recipient has demonstrated a high degree of engagement, it is a contact who carries out activities consistently on campaigns |
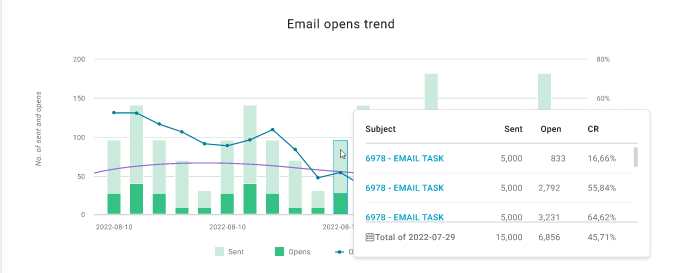
Email opens trend
The Email Opens Trend shows:
- the number of opens recorded each day (dark green bar) and the total number of mailings (the totality of the bar)
- open rate trend (blue line)
- variation compared to the open rate in the selected time frame (purple line)
By selecting the bar of a single day, it is also possible to have the details for each email sent including the open rate, the number of emails sent, and the number of opens.
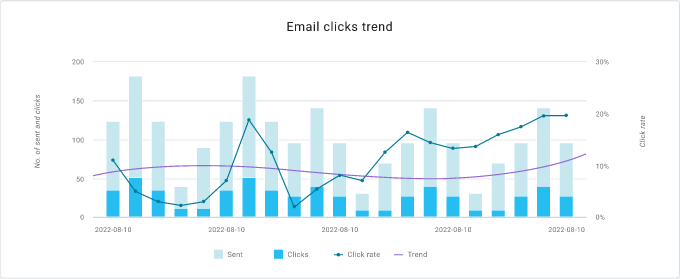
Email click trend
The Email Click Trend shows:
- the number of clicks recorded each day (dark blue bar) and the total number of mailings (the totality of the bar)
- open rate trend (blue line)
- variation compared to the click rate in the selected time frame (purple line)
By selecting the bar of a single day, it is also possible to have the details for each email sent including open rate, the number of emails sent, and the number of clicks.
Top Provider trend
The top Provider trend dashboard provides an overview of the 4 main recipients' providers. The data is automatically obtained from the platform based on the recipients' domain and cannot be changed by inserting other providers.

Engagement filters
The contacts belonging to the various categories of engagement, with the addition of the "Excluded" (ie those contacts to whom not even a message has been sent in the last 6 months), can be identified through the use of the Engagement Filters.